With ggplot 3.5.1, patchwork 1.3.0 and R4.4.2, the guides from a histogram and a density plot as specified below were merged into one as long as the color was removed from the density plot. I have just reloaded that configuration and tested that the guides are correctly collected into one.
With ggplot 4.0, patchwork 1.3.2 and the dev version 1.3.2.9 in R4.5.1 this no longer works. No matter what I do I get two legends as shown below. I can't see why these two scales would be different. I don't know if change is due to the new ggplot2 configuration or something in patchwork. Any chance the functionality could be returned?
Thanks so much!
library(patchwork)
library(ggplot2)
data("iris")

hist.group <- ggplot(iris, aes(Sepal.Length, fill = Species)) +
    geom_histogram()

density.group <- ggplot(iris, aes(Sepal.Length, fill = Species)) +
    geom_density(color = NA)

(hist.group | density.group) +
    plot_layout(guides = "collect") &
    theme(legend.position = "bottom")
#> `stat_bin()` using `bins = 30`. Pick better value `binwidth`.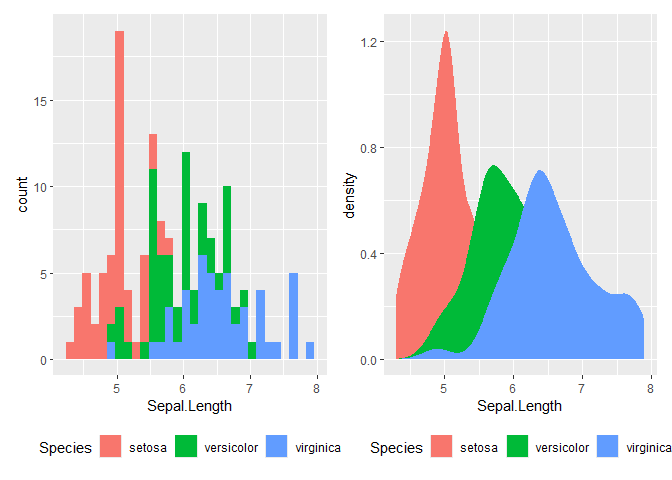
Created on 2025-10-22 with reprex v2.1.1
With ggplot 3.5.1, patchwork 1.3.0 and R4.4.2, the guides from a histogram and a density plot as specified below were merged into one as long as the color was removed from the density plot. I have just reloaded that configuration and tested that the guides are correctly collected into one.
With ggplot 4.0, patchwork 1.3.2 and the dev version 1.3.2.9 in R4.5.1 this no longer works. No matter what I do I get two legends as shown below. I can't see why these two scales would be different. I don't know if change is due to the new ggplot2 configuration or something in patchwork. Any chance the functionality could be returned?
Thanks so much!
Created on 2025-10-22 with reprex v2.1.1